Narrowing in on Equilibrium Climate Sensitivity
/A post by Gavin, Phil Goodwin and Eelco Rohling
A fundamental variable in describing how warm our future will be is the equilibrium climate sensitivity (ECS) – the global mean surface temperature change in response to a doubling of atmospheric CO2, once the system has reached equilibrium. Assessing the impact of anthropogenic climate change has been framed in these terms for nearly 120 years since Svante Arrhenius in 1896 (LINK). However, a precise value for Earth’s ECS has stubbornly resisted determination over this time – see this figure I have modified from Steve Schwartz.
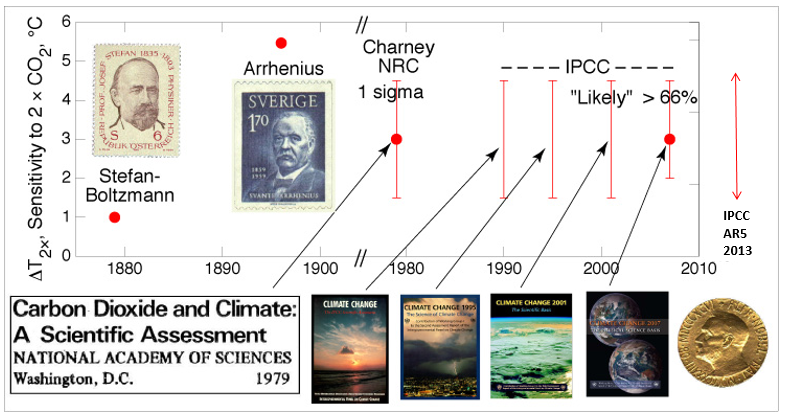
The evolution of the estimates of equilibrium climate sensitivity over the last 130 years. From Steve Schwartz with the addition of the 2013 AR5 IPCC report. http://www.ecd.bnl.gov/steve/schwartz.html
This apparently lack of scientific progress was exemplified in the last IPCC report in 2013 when, instead of quoting a most likely value as previous reports had done, the best estimate of ECS based on multiple methods was that it was likely (i.e. with a 66% probability) in the range of 1.5 to 4.5 C per CO2 doubling. This is arguably something we have known since the late 70s (although by luck rather than judgement; see figure above). With the international agreement in Paris in 2015 to limit global warming to 1.5 or 2 C this uncertainty in the true value of ECS has come into sharp focus - quite simply in order to ensure we don’t go above 1.5 or 2 C we first need to know how sensitive the climate system is.
In the last year, with an eye on these targets, there have been a number of attempts to narrow in on the real value of the Earth’s ECS. For instance, Armour (2017; doi:10.1038/NCLIMATE3278) showed that because climate feedbacks operate on different spatial and temporal scales, simple energy balance approaches, though elegant, tend to biased low (by ~26%). Brown and Caldeira (2017; doi:10.1038/nature24672), confronted climate model output with a series of observations, and those models that best matched the observations were found to describe a narrower range in ECS. Finally, last week Cox et al. (2018, doi:10.1038/nature25450) found that only a subset of the available climate models exhibited a similar level of year-on-year variation in climate to what is observed in the historical record. Interestingly, this subset of models also had similar and narrow range of ECS. Taken together, these recent advances suggest that an ECS of <2 or >4.5 is unlikely (summarised nicely by a Nature news and views article by Piers Forster and this figure below).

Recent estimates of equilibrium climate sensitivity. The estimate from the IPCC (2013) is based on several lines of evidence. Bars depict the ranges for which there is a 66% likelihood of the value being correct. Best estimate is a blue line. From Forster (2018).
Our latest paper, published today (22/01/2018; Goodwin et al. 2018, doi:10.1038/s41561-017-0054-8), continues this recent trend of narrowing in on the real value of ECS for the Earth in its current state. In contrast to these other studies we used a much simpler model (the WASP Earth System model, http://www.waspclimatemodel.info) but one that could be run many times with different input parameters. The accuracy of the outputs could then be tightly constrained by observations of anthropogenic climate change (e.g. surface warming, ocean heat up take etc.), thereby identifying the most realistic parameter sets and so most accurate model runs. We started from the premise that the geologically constrained estimates of ECS from the Palaeosens study (Rohling et al., 2012, doi:10.1038/nature11574), represent a good, if uncertain, approximation of the Earth’s true sensitivity (in Bayesian terms this is our prior). We found that, given the uncertainties in climate forcing over the last 100 years, only a subset of the initial geologically-determined ECS was able to generate climate change in WASP that adequately agreed with the available observational datasets (e.g. ocean heat uptake and surface warming). Like in the other studies discussed above, this subset (our posterior) had a much narrower distribution of ECS: a most likely value of around 2.7 C per CO2 doubling and a 66% likelihood range of 2.3 to 3.2 C. This agrees remarkably well with estimates of Cox et al. (2018) as shown in this figure.
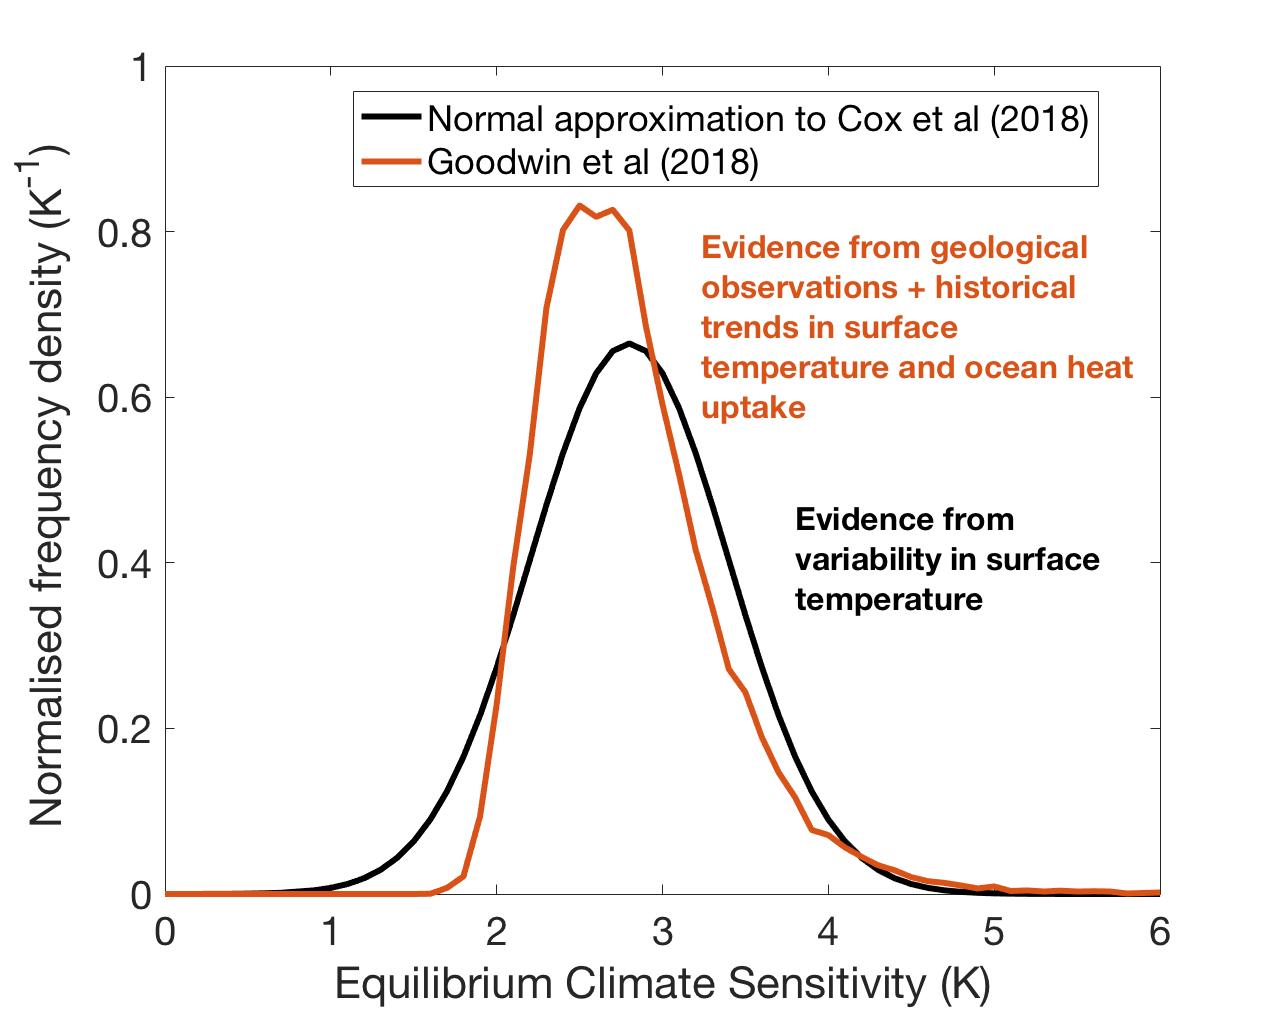
Estimates of ECS from Goodwin et al. (2018) and Cox et al. (2018). NB – for plotting we have assumed a normal distribution from Cox et al. (2018). Our 66% range is 2.3 to 3.2 C per CO2 doubling with a most likely value of 2.7. Cox's 66% range is 2.2 to 3.2 C with a most likely value of 2.8 C per CO2 doubling..
At face value, this appears to be great news. For instance, the extreme global warming implied by an ECS >5 C now appears to be very unlikely, as does the possibility of a “lukewarm” sensitivity. However, there is a downside too, because by reducing uncertainties in ECS we are also reducing our “wiggle room” in climate negotiations and emission-reduction actions. To illustrate this in Goodwin et al. (2018), we take our subset of observationally consistent models and see how quickly they approached 1.5 and 2 C above pre-industrial, given current emission rates (see figure below). What we find is startling – within 17-18 years we are likely to have reached the 1.5 C target and by 35-41 years we will have reached 2 C above pre-industrial levels. So, rather than being relieved that our study rules out extreme climate change on century timescales, we place the need to rapidly decarbonise our society into ever more sharp focus.

Cumulative carbon emissions and warming projects from our observationally consistent ensemble. From these plots, given a known rate of emissions, the time at which a target T is crossed can be calculated. From Goodwin et al. (2018).